
Plesk is one of the most popular web hosting control panels that provides a wide range of tools for managing websites, emails, databases, and much more. Among its many features, Plesk also offers detailed statistics that help users track the performance and resource usage of their websites. Monitoring these statistics is crucial for web admins to ensure their sites are running smoothly and efficiently.
In this blog post, we’ll walk you through the process of checking the statistics in the Plesk Control Panel, explaining how to view data such as bandwidth usage, traffic, disk space, and more.
Table of Contents
Why Monitor Statistics in Plesk?
Monitoring statistics allows you to:
- Track resource usage: Ensure you’re not exceeding your hosting limits for bandwidth, disk space, or other resources.
- Monitor website performance: Identify traffic trends and analyze performance bottlenecks.
- Ensure data security: Keep an eye on abnormal activity that may indicate security risks, such as DDoS attacks.
- Optimize hosting: Adjust your hosting plan based on the actual needs of your website.
With these benefits in mind, let’s dive into how to access and interpret the statistics in Plesk.
Prerequisites
Before you can check statistics in Plesk, make sure you have the following:
- Access to Plesk login credentials.
- A hosting account where your website is managed through Plesk.
Step-by-Step Guide to Checking Statistics in Plesk Control Panel
Step 1: Log in to Plesk Control Panel
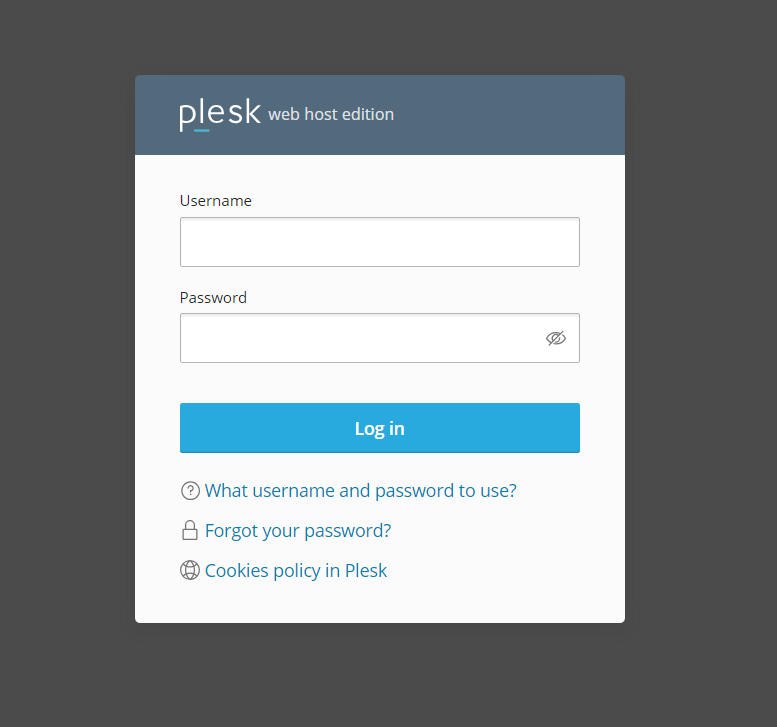
The first step to check your website’s statistics is to log into your Plesk Control Panel. You can access the login page by visiting the URL provided by your hosting provider. Enter your username and password to log in.
Step 2: Navigate to the “Statistics” Section
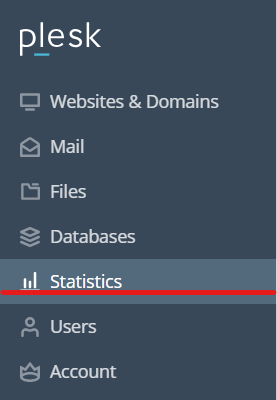
Once logged in, find the “Statistics” option in the left-hand menu. This section provides all the necessary data related to your website’s performance and resource usage. Click on Statistics to access the relevant details.
Step 3: Overview of Statistics in Plesk
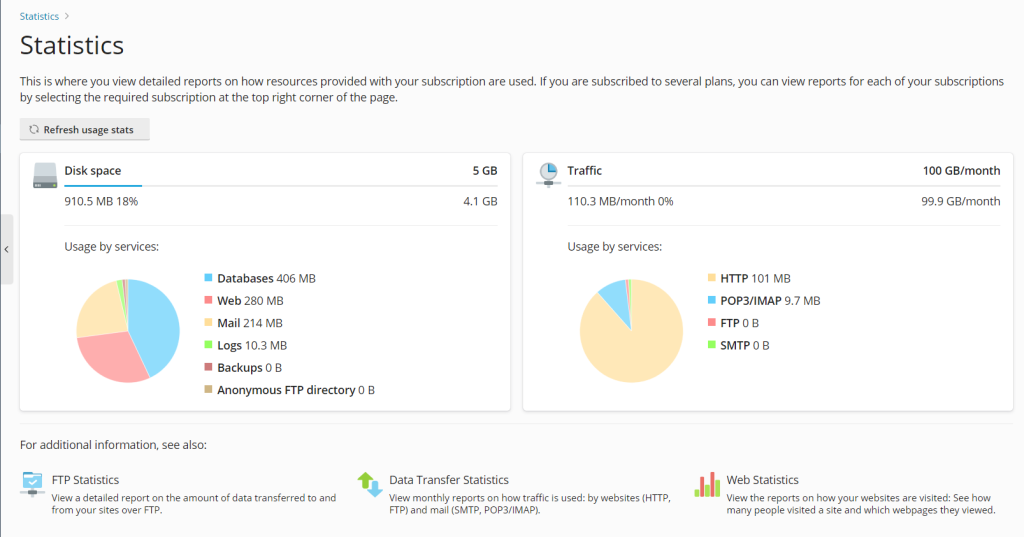
In the Statistics section, you’ll see an overview of key data, including:
- Disk Usage: How much disk space your website is consuming.
- Traffic: Information on incoming and outgoing traffic, including bandwidth usage.
- Web Traffic: This section provides details about website visitors and pageviews.
- Email Usage: Data on the number of emails sent and received.
Each of these sections provides an overview of the respective resources used by your account. For more in-depth data, you can click on the specific category.
Step 4: Check Bandwidth Usage
One of the most important statistics to monitor is Bandwidth Usage. This tells you how much data is being transferred from your server to visitors over a specific period. To check this:
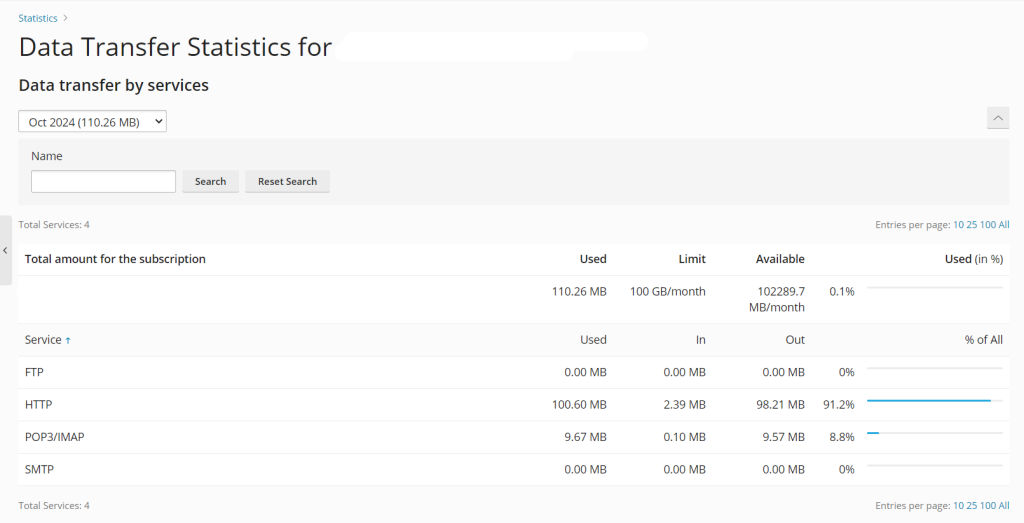
- In the Statistics section, look for Traffic.
- Here, you’ll see bandwidth usage broken down by month or day.
- You can also view the data per domain, which helps if you’re managing multiple domains under one account.
Monitoring bandwidth usage helps prevent your site from going offline due to exceeding your hosting plan’s limits.
Step 5: Check Disk Space Usage
To keep your website running efficiently, it’s important to regularly check your Disk Space Usage. This will tell you how much space your website files, emails, databases, and logs are occupying. Follow these steps:
- In the Statistics section, select Disk Usage.
- The dashboard will show a detailed breakdown of how your disk space is being used. This includes website files, emails, databases, and other resources.
- If you’re running low on disk space, consider deleting unnecessary files or upgrading your hosting plan.
Step 6: Check Website Traffic Statistics
Website traffic data is crucial for understanding the performance of your site. In Plesk, you can access traffic statistics to monitor the number of visitors and pageviews. Here’s how to check:
- In the Statistics section, click on Web Traffic.
- This will display data on website visitors, including the number of hits, pageviews, and visitor IPs.
- You can also monitor traffic trends over time, helping you identify peak periods of activity.
Step 7: Check Email Statistics
Plesk also provides information on Email Usage, including the number of emails sent and received by each email account. Here’s how to access these statistics:
- In the Statistics section, click on Mail.
- You’ll see a breakdown of email activity, including the number of emails sent, received, and any issues related to email quotas.
Monitoring email statistics is useful for identifying spam or ensuring your account doesn’t exceed the email limits set by your hosting plan.
Step 8: Detailed Resource Usage Report
For a more detailed view of all resources used by your account, you can generate a Resource Usage Report in Plesk. This report includes detailed data on disk space, bandwidth, databases, and email usage. To generate the report:
- Navigate to Tools & Settings.
- Select Resource Usage.
- You can customize the time range and the specific statistics you want to view.
- The report can be exported for further analysis or record-keeping.
How to Set Up Notifications for Resource Usage
Plesk allows you to set up automatic notifications for resource usage, helping you keep track of critical resources such as bandwidth or disk space. Follow these steps to set up notifications:
- Navigate to Tools & Settings in the left-hand menu.
- Click on Notifications.
- Select the type of notifications you’d like to receive (e.g., bandwidth, disk space).
- Set the threshold and email address where the notifications will be sent.
Setting up these notifications ensures you’ll be alerted if your website approaches its resource limits, allowing you to take action before service interruptions occur.
Common Issues When Checking Statistics in Plesk
While checking statistics in Plesk is generally straightforward, some common issues include:
- Slow Load Times: If your statistics take too long to load, it could indicate performance issues with your server.
- Outdated Data: If the statistics are not updating in real-time, your hosting provider might need to adjust the server settings.
- Incorrect Data: If you notice discrepancies in the reported statistics, you may need to contact your hosting provider to ensure there are no system errors.
Conclusion
Monitoring your statistics in Plesk Control Panel is an essential part of managing your website. It provides you with valuable insights into your resource usage, website performance, and potential areas of improvement. By regularly checking bandwidth, disk space, traffic, and email usage, you can ensure your website runs smoothly without any interruptions.
With Plesk’s comprehensive statistics features, you can stay in control of your website’s health and take timely actions to prevent any performance issues. Be proactive in monitoring your resource usage, and use the data to optimize your website’s performance, ensuring it meets your visitors’ needs effectively.